
Ranking Every Single Caps Contract Using Analytics: Caps' Cap Analysis Part Two
Every Caps contract ranked by efficiency, from Nic Dowd to Tom Wilson

A few weeks ago, I started a three-part series intended to take a deep and analytical look at the Capitals’ salary cap situation. In part one, I took a look at where the Caps are currently allocating their money. If you haven’t read that yet, you should start there, since it gives an overview of the plan for the whole series and provides important background for the analysis contained here.
Today, I’m taking a look at how efficiently the Caps’ money is currently being spent. In other words, where are the Caps getting what they’re paying for, where are they overspending, and where are they getting a great deal? These questions are hard to answer and involve a deep look at where money is translating to on-ice performance. I’ve compiled analytics from a range of sources into this original analysis on the Caps’ spending efficiency. I’ll start by ranking the Capitals’ contracts on my own metrics and then discussing how that might play out this season.
Ranking the Caps’ contracts by efficiency
I first wanted to get a quantitative sense of how the Caps’ contracts looked relative to each other. To do this, I need both input and output variables. The input variable is how much a player gets paid. This is easy enough; I used the average annual value, or cap hit, of each player’s contract as reported by PuckPedia. An outcome variable is more difficult. In order to standardize the metric, I need a single number that will quantify a player’s on-ice contributions. Points, for example, are imperfect because they capture only offensive output and also fail to distinguish between goals and secondary assists, which should not be treated as the same thing. The best publicly-available single number for this purpose, in my opinion, is Hockey Reference’s point shares metric, which aims to quantify the number of standings points that can be attributed to a given individual player’s play. Point shares include both offensive and defensive contributions, and it fuses all kinds of on-ice play into a single number. For an excellent and exhaustive explanation of how they’re calculated, see Hockey Reference’s page on the subject.
Still, while this number is good, it can be vulnerable to a few issues. One is that it is variable, and I didn’t want to assess players only by their most recent season. To remedy this, I compiled each Caps player’s point share values in each of his past three seasons and then calculated a weighted average, assigning more weight to more recent seasons in the average. This gave me a sense of how each player has contributed to team success over his past three seasons, with a bias toward a “what have you done for me lately” attitude that nonetheless doesn’t entirely discount prior performance. I think this fairly reflects what the Caps can reasonably expect each player to output in terms of point shares in the upcoming season, which is the season relevant to this analysis. Later in the article, I’ll refer to this metric as “expected point shares” or “xPS,” but it shouldn’t be confused with expected goals or similar metrics, which are not predictive (like xPS) but rather descriptive of probabilistic past happenings.
Another weakness of point shares is that they are a cumulative metric, which means that injuries or time spent outside the NHL (in the minors, for example) will not accrue point shares. I chose not to remedy this; in my view, if a player has spent time injured or in the minors, the Caps (or his NHL team) have not been benefitting for the money they are paying him in that time through on-ice performance. I’m ok with my metric “punishing” the player for that.
Finally, point shares advantage players who get to play in certain roles. For example, a player on the power play will almost certainly accrue more point shares than the hypothetical exact same player who wasn’t on the power play. To some extent, this is ok - for one, we expect that guys on the power play are there for a reason, and for another, they still have to be out there and earn the point shares. But it can skew results still, especially away from defensive defensemen who play penalty kill minutes but not power play minutes. I will discuss this in more detail in some of my comments on individuals later in the article, but it’s worth keeping in mind as you look through the chart.
Ok, time for the big reveal. Here’s every Caps contract ranked by his 24-25 expected point share contribution per million dollars in 24-25 cap hit. The chart is colored by the AAV of the contract—darker blues signify more expensive contracts.
Caps’ Contracts: the Good, the Bad, and the Middle
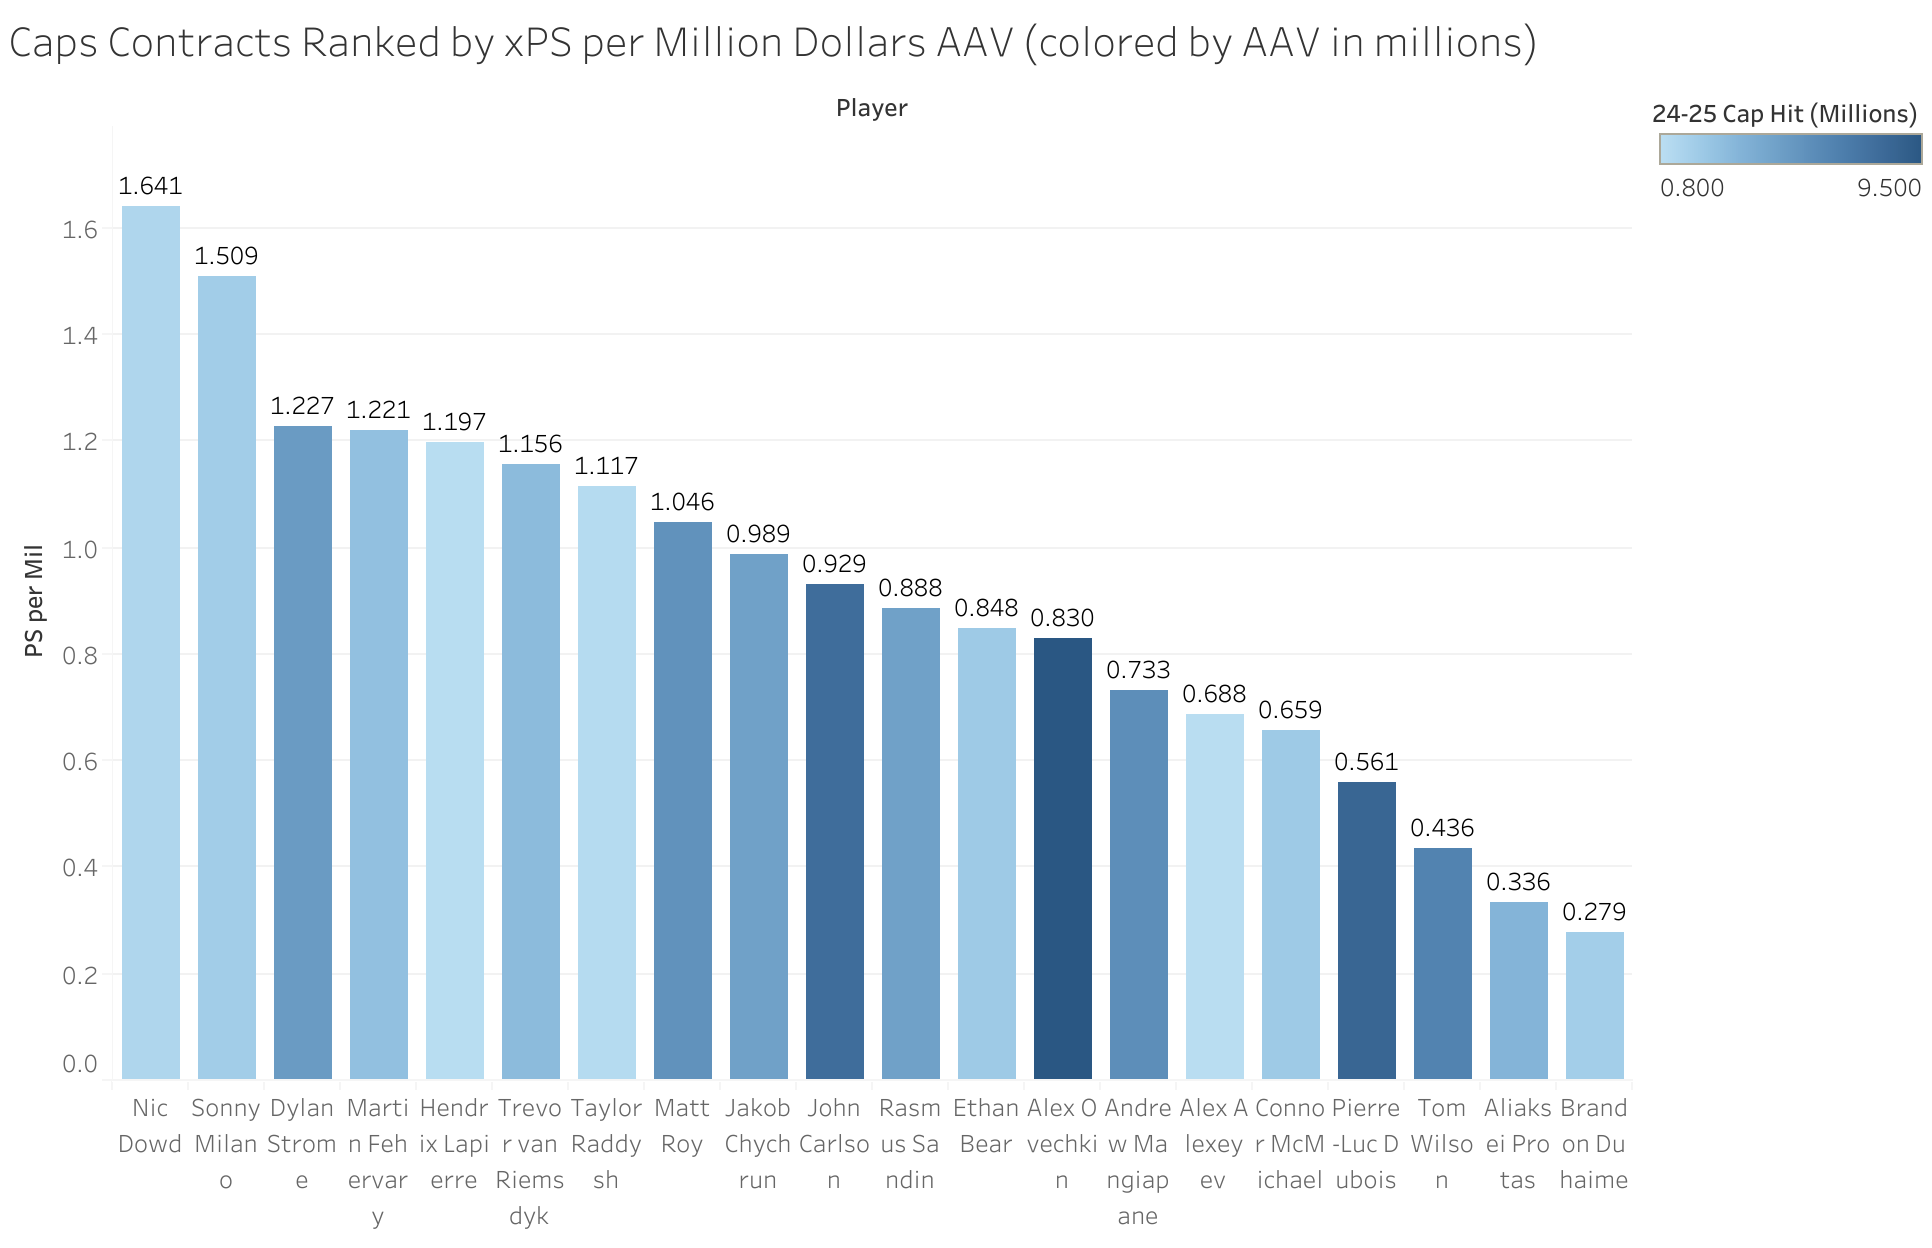
What do we see in this chart? First, for the bad stuff, Tom Wilson’s contract still looks bad, as I discussed in Part One. Pierre-Luc Dubois’s is similar. Alex Ovechkin is on the decline and still paid handsomely—for a far more detailed look at his decline and record chase, check out our post from last week. Young players like Connor McMichael and Aliaksei Protas also fall toward the lower end of this spectrum after signing recent post-ELC deals, but I’m more willing to be forgiving with them given the fact that, as young players, they might be expected to grow into their deals rather than justify them with prior play. The metric I’m using is weighted to recent performance, but it’s still retrospective, so it’s fair to expect growth from these players that will justify their contracts. I’d put them in the “check back in in a year or two” category of contracts, rather than the overtly bad or overtly good.
In the good column, the Caps found value in new guys Matt Roy and Jakob Chychrun. But I want to take the time to highlight their best performing players: Nic Dowd, Sonny Milano, and Dylan Strome form a core of players that Brian MacLellan found in the free agent market and subsequently signed to fantastic contracts. Notable is that all three are relatively good defensive forwards. Milano ranked third on the Caps in 5v5 expected goals against per 60 minutes last year with 2.25, while Dowd ranked eighth despite incredibly difficult deployment (2.47) and Strome 12th (2.65). Strome, meanwhile, ranked comfortably first in on-ice 5v5 expected goals for per 60 at 3.05. The next highest Cap was Anthony Mantha, who was traded away at the trade deadline last year, at 2.75. MacLellan’s free agent strategy has been analytically informed and has focused on certain profiles of player (previously underutilized but possessing good two way play driving numbers), and these three are great evidence that the strategy is paying off on the ice and on the cap sheet.
In the middle are most of the Caps’ defensemen, including John Carlson. Carlson is hanging on to some success, but he’s likely to decline toward the bad end of this chart as he ages. Rasmus Sandin is similarly signed to a relatively rich contract, but he’s still young and looking to bounce back next year. Hendrix Lapierre looks good right now, but that’s artificially related to his entry level contract—when he inevitably gets a raise after this season, I doubt he’ll look as good.
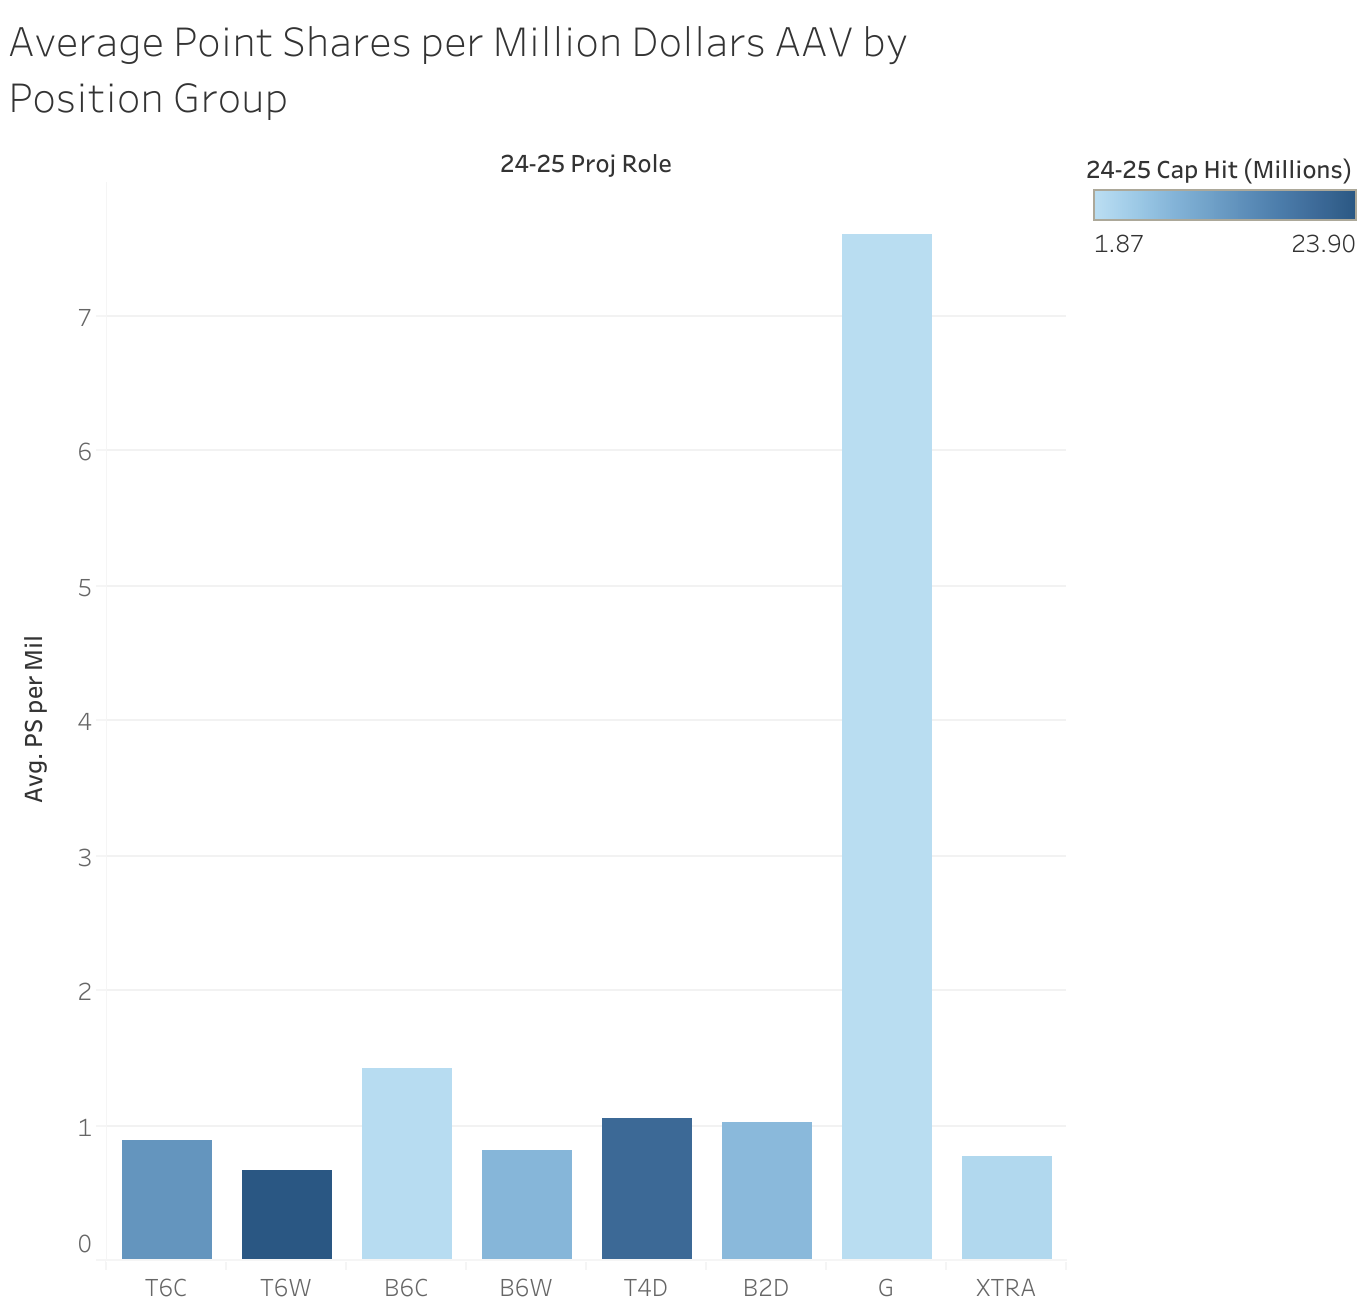
Also useful is analyzing efficiency by position group. I’ve added the goalies to this one as well. This chart tells a similar story. The Caps are paying a lot for top six forwards who aren’t performing, and they’re not paying much for bottom six forwards who largely are performing. They’re paying a lot for top four defensemen who are mostly performing and a decent amount for bottom pair defensemen who are largely performing too. And they’re paying next to nothing for goalies who are expected to be fantastic. In other words, it’s pretty obvious where the good and bad contracts are for the Caps right now.
In short, the Caps are relatively well-positioned cap-wise. They have some really efficient contracts in terms of output on the ice, and their downside isn’t so bad outside of a few aging stars who are around for sentimental and leadership reasons beyond simply what translates on the ice. In part three of the series, I’ll look ahead at the Caps’ salary cap future and preview the next few years of flexibility.